Indonesia’s Makan Bergizi Gratis (MBG) program feeds school students, pregnant women, breastfeeding mothers, and young children through local kitchens called Satuan Pelayanan Pemenuhan Gizi (SPPG). It is administered by the Badan Gizi Nasional (BGN), and its procurement model reaches farmers, fishers, cooperatives, and small businesses.
That scale makes it a good subject for news analysis. Coverage spans beneficiary access, kitchen expansion, food safety, procurement, public finance, regional implementation, oversight, and political accountability.
This page reports what the coverage looks like in aggregate. I collected 10,915 cleaned articles from 52 Indonesian news sources, covering 5 January 2025 through 31 July 2026, using news-watch, a scraper I maintain. The figures come from a collection run on 6 August 2026.
It is adapted from the full method writeup in the news-watch documentation, which carries the collection command, the five validation steps, the counts at each cleaning stage, and the citation formats. Read that one if you want to reproduce the corpus. Read this one for what the corpus shows.
This replaces an earlier edition. That one ran over a smaller corpus and a shorter window, and it reported topic numbers with more confidence than the method supports. Every count here has been regenerated, none of the old totals carry forward, and the topic figures now ship with what happens to them when the random seed changes.
What to take from this, and what not to
Every figure below describes one retrieval run, not the Indonesian news ecosystem. A count of 10,915 documents is evidence about what these 52 sources exposed to a keyword search on 6 August 2026. It is not an estimate of how many articles were written.
Topic labels are provisional English summaries of auto-generated Indonesian term statistics, reviewed by hand. Entity names are unresolved NER surfaces. Both are working labels, not validated categories.
Article text, titles, URLs, and document-level outputs stay in a private research workspace. Only aggregates are published here.
What the coverage is about
The corpus resolves to 14 substantive topics plus an outlier class for documents that do not cluster cleanly. The topics cover program governance and institutional oversight, corruption investigations and prosecutions, student food-poisoning incidents, budget allocation and disbursement, SPPG kitchen construction and police-run operations, electric-motorcycle and vehicle procurement, Jakarta policing and school incident response, dairy production and cattle supply, SPPG site locations and regional coordinators, health ministry programmes and TB treatment, music and viral video mentions, listed agrifood companies and share prices, fisheries and marine food supply, and children, infants, and family nutrition.
The outlier class is large, and saying so matters more than hiding it: 4,031 documents, 36.9% of the corpus, carry no topic at all. Every topic-level number below therefore describes the other 63%. That share is one of the few stable things here: refitting under five different projection seeds moves it only between 34.6% and 37.8%, and the substantive topic count comes out at 14 every time.
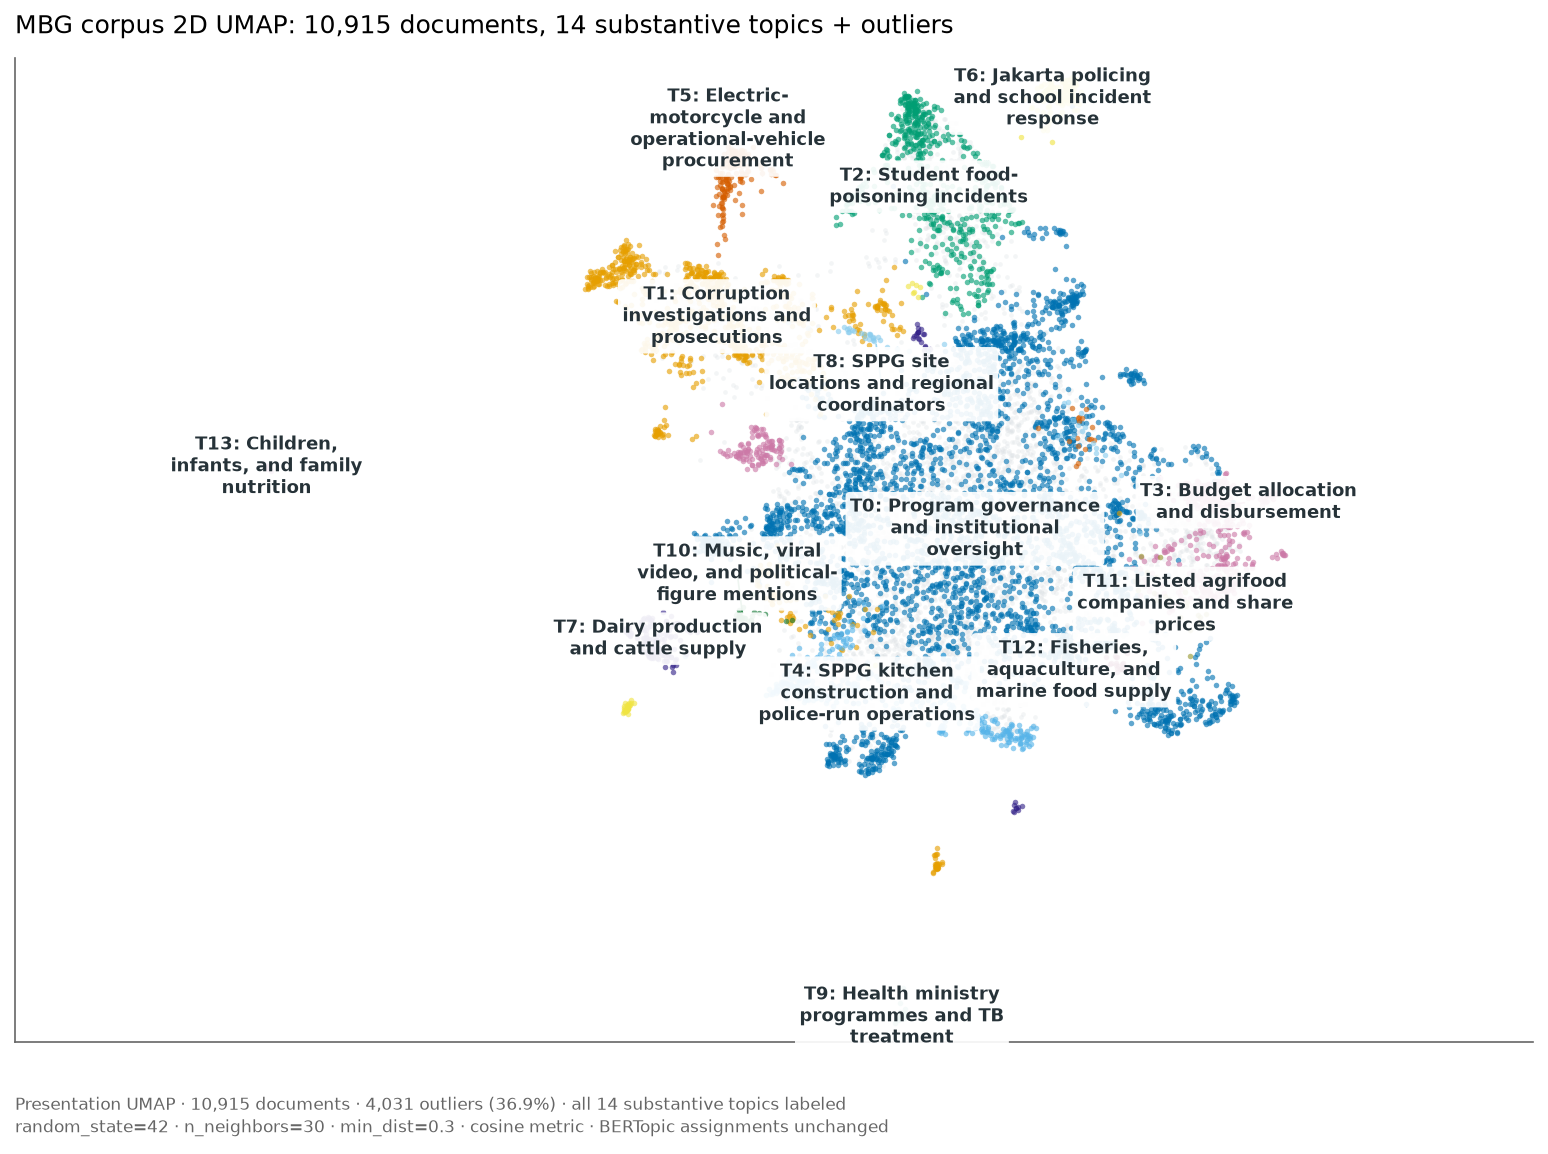
A two-dimensional UMAP projection, one point per document, all 14
substantive topics labeled over their cluster regions. Grey points are
documents the clustering model left unassigned. Separation and overlap here
are diagnostic patterns, not proof the labels are real categories. The
layout uses a dedicated readability projection (random_state=42,
n_neighbors=30, min_dist=0.3, metric=cosine) that is separate from the
analysis UMAP inside the BERTopic pipeline. Only the two-dimensional layout
differs, never the topic assignments.
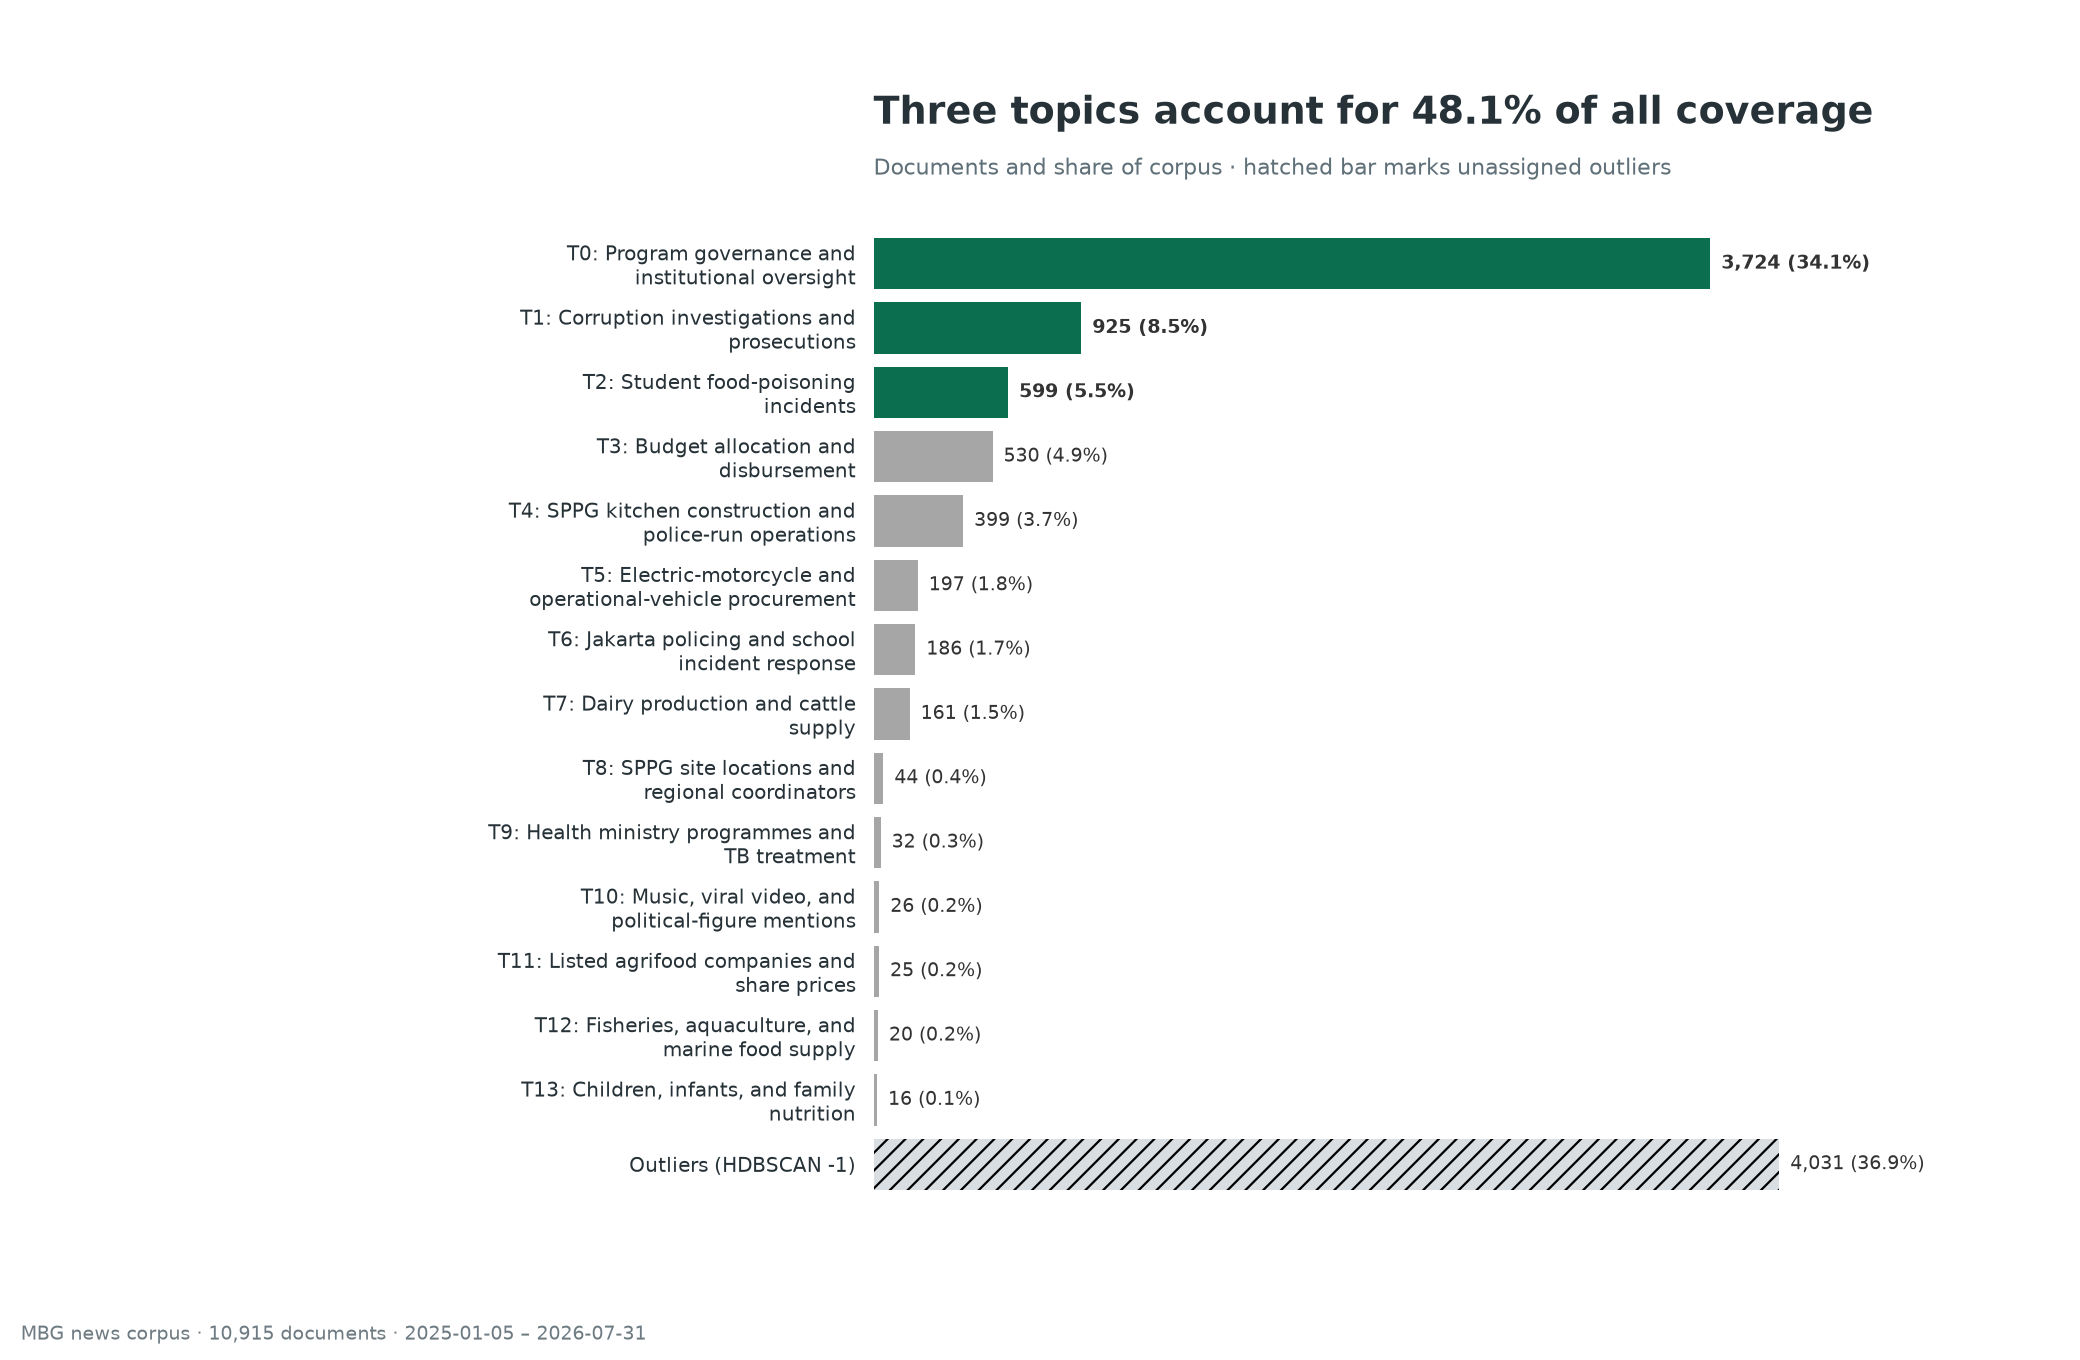
Coverage is concentrated. The three largest topics account for 5,248 of 10,915 documents, 48.1% of the corpus, and T0 alone holds 3,724. So everything outside the single biggest topic rests on roughly a quarter of the corpus.
Both figures move with the seed. Across five projection seeds the three largest topics span 4,745 to 5,796 documents, 43.5% to 53.1% of the corpus, and T0 spans 2,815 to 4,209. The shape holds every time, one dominant topic and a long thin tail. The specific counts do not.
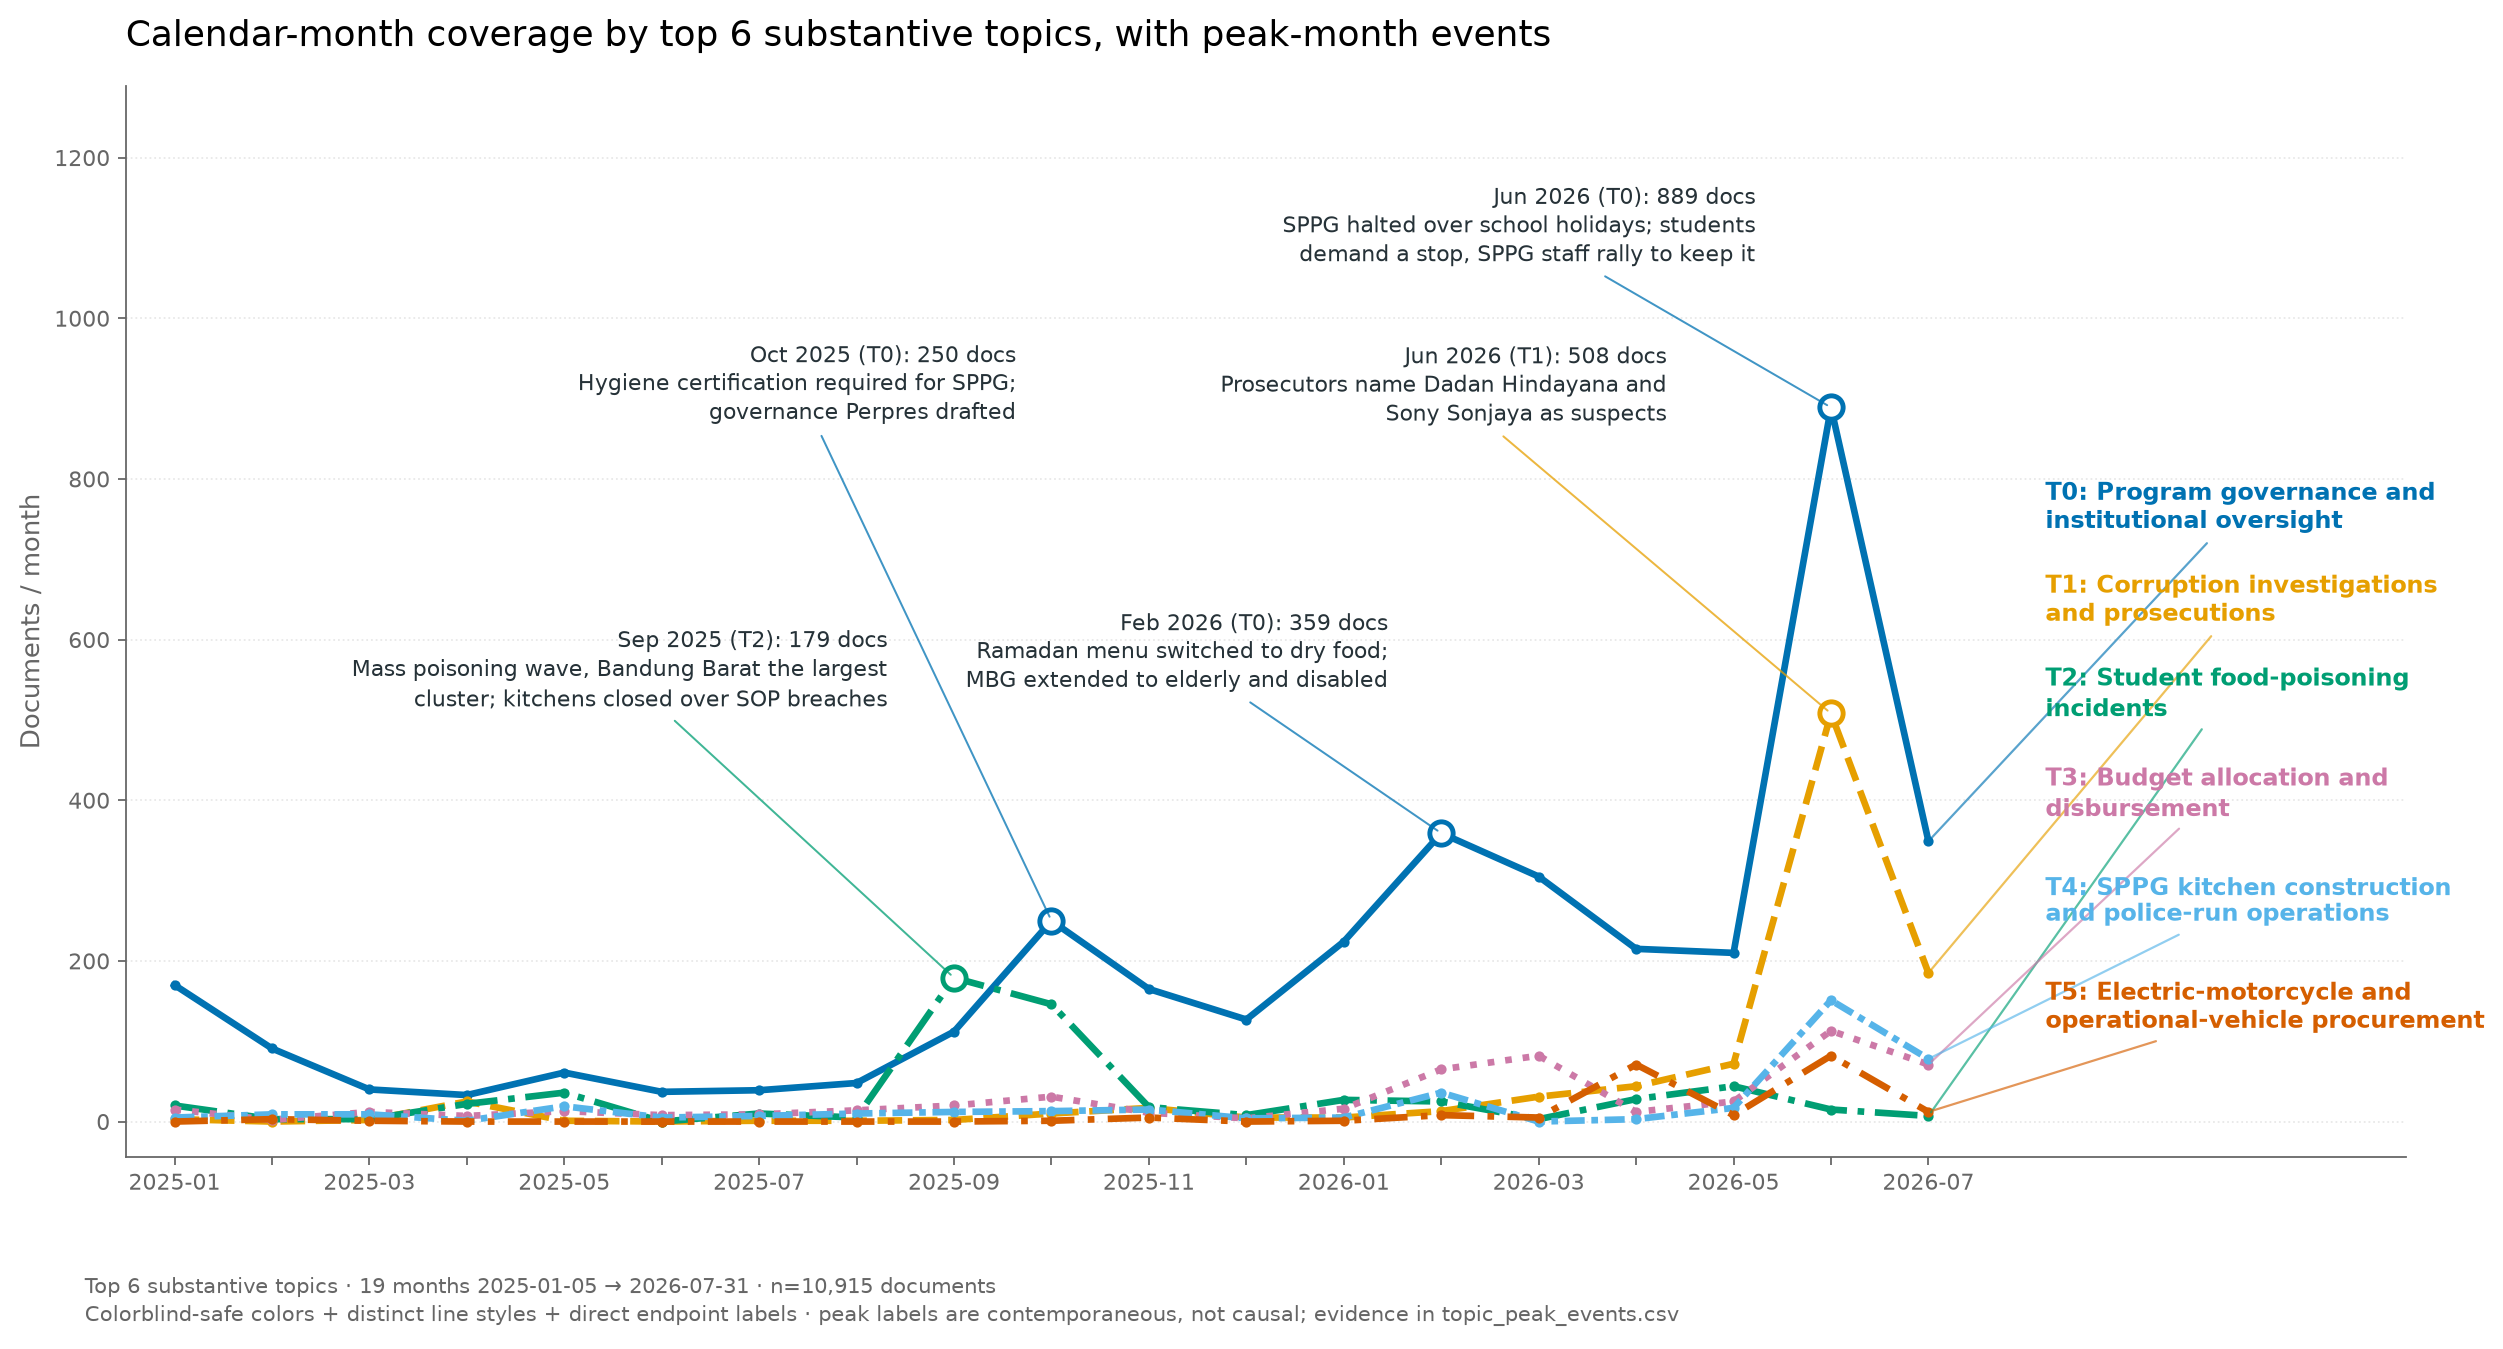
Monthly volume for the six largest topics across the 19 calendar months: T0 program governance and institutional oversight, T1 corruption investigations and prosecutions, T2 student food-poisoning incidents, T3 budget allocation and disbursement, T4 SPPG kitchen construction and police-run operations, T5 electric-motorcycle and vehicle procurement. Each series uses a distinct colorblind-safe color and line style, with the label printed at the right-hand endpoint so the chart reads without relying on color.
Five points carry exact counts:
- September 2025, T2, 179 documents. Mass poisoning wave, Bandung Barat the largest cluster, kitchens closed over SOP breaches.
- October 2025, T0, 250 documents. Hygiene certification required for SPPG, governance Perpres drafted.
- February 2026, T0, 359 documents. Ramadan menu switched to dry food, MBG extended to elderly and disabled recipients.
- June 2026, T1, 508 documents. Prosecutors name Dadan Hindayana and Sony Sonjaya as suspects.
- June 2026, T0, 889 documents. SPPG halted over school holidays, students demanding a stop and SPPG staff rallying to keep it.
The peak months are stable. The peak counts are not. Under five projection seeds every one of these topics peaks in the same month it does here, but the counts move: the T0 June peak spans 606 to 889, the T1 June peak 435 to 508, the T2 September peak 179 to 218. The numbers printed above come from the published model’s seed, and for T0 and T1 they are the highest of the five.
So cite the all-document figure, not the topic one. Across every document, June 2026 is 3.20x its predecessor, 2,761 against 863 in October 2025. That comparison uses no topic assignment at all, which is what makes it the reliable statement of the spike. Restricted to the three largest topics the same month reaches 1,412 documents, about 3.5x their previous combined peak of 406, but that multiple ranges from 1.95x to 3.5x across seeds and the value quoted is the largest of the five.
Treat the peak as real and the multiple as an upper bound. Distinct sources contributing per month rise from 17 to 45 across the window, so later months are searchable by more sources than earlier ones, and raw month-over-month growth is partly an artifact of coverage rather than of events. The callouts name coverage families contemporaneous with each peak. They do not claim those events caused the volume, and the pattern describes this corpus only. Public reporting documents the same coverage families:
- Bandung Barat mass-poisoning response, ANTARA (September 2025)
- Ramadan dry-food adaptation statement, ANTARA
- BGN school-holiday audit of MBG kitchens, ANTARA
- SPPG safety certification push after poisoning cases, Kompas
How much of the topic layer holds
The number of topics is an editorial choice, not something the corpus dictates. The reduction target behind these fourteen was picked on a corpus about a third of this size, from the candidates 10, 12, 15, and 18, using one test: does the largest topic swallow most of the assigned documents? 10 and 12 did, and were rejected on that basis.
Two things follow. Twenty and above were never candidates, so the published setting was never compared against them. And the test that justified it no longer passes, because the largest topic now holds 54.1% of assigned documents, which is the same mega-topic behaviour that got 10 and 12 rejected.
So the resolution was swept from 8 to 40 in steps of 2, under five projection seeds, with twenty bootstrap resamples at 90% of the corpus, against three criteria fixed before the sweep.
| criterion | resolutions that pass |
|---|---|
| shape: no dominant bucket, no shattering | 28, 30, 32 |
| cross-seed agreement | 10, 36, 38 |
| bootstrap survival | 26 |
No resolution passes more than one criterion. The intersection is empty, and it stays empty under every way of aggregating the shape criterion across seeds. Mean cross-seed agreement never exceeds 0.606 anywhere on the grid, so this is not a badly chosen topic count. It comes from the projection and clustering stage, which is also where the 36.9% outlier share is set, and refitting at a different target would not repair either.
What that means for reading the rest of this page: the fourteen topics are a reading aid for the volume and sentiment figures, not a set of categories the corpus contains. The three largest are identifiable across seeds, matching at 0.50 to 0.79 by document overlap. Below them it degrades sharply. The budget topic matches at 0.12 to 0.55 and the SPPG-construction topic at 0.10 to 0.77, which means a topic present in one run may have no counterpart in another.
What the largest topic actually contains
Reduction merges clusters, it never re-clusters, so every display topic has a fan-in: the set of underlying clusters folded into it. For twelve of the fourteen topics that number is small, a median of 2.
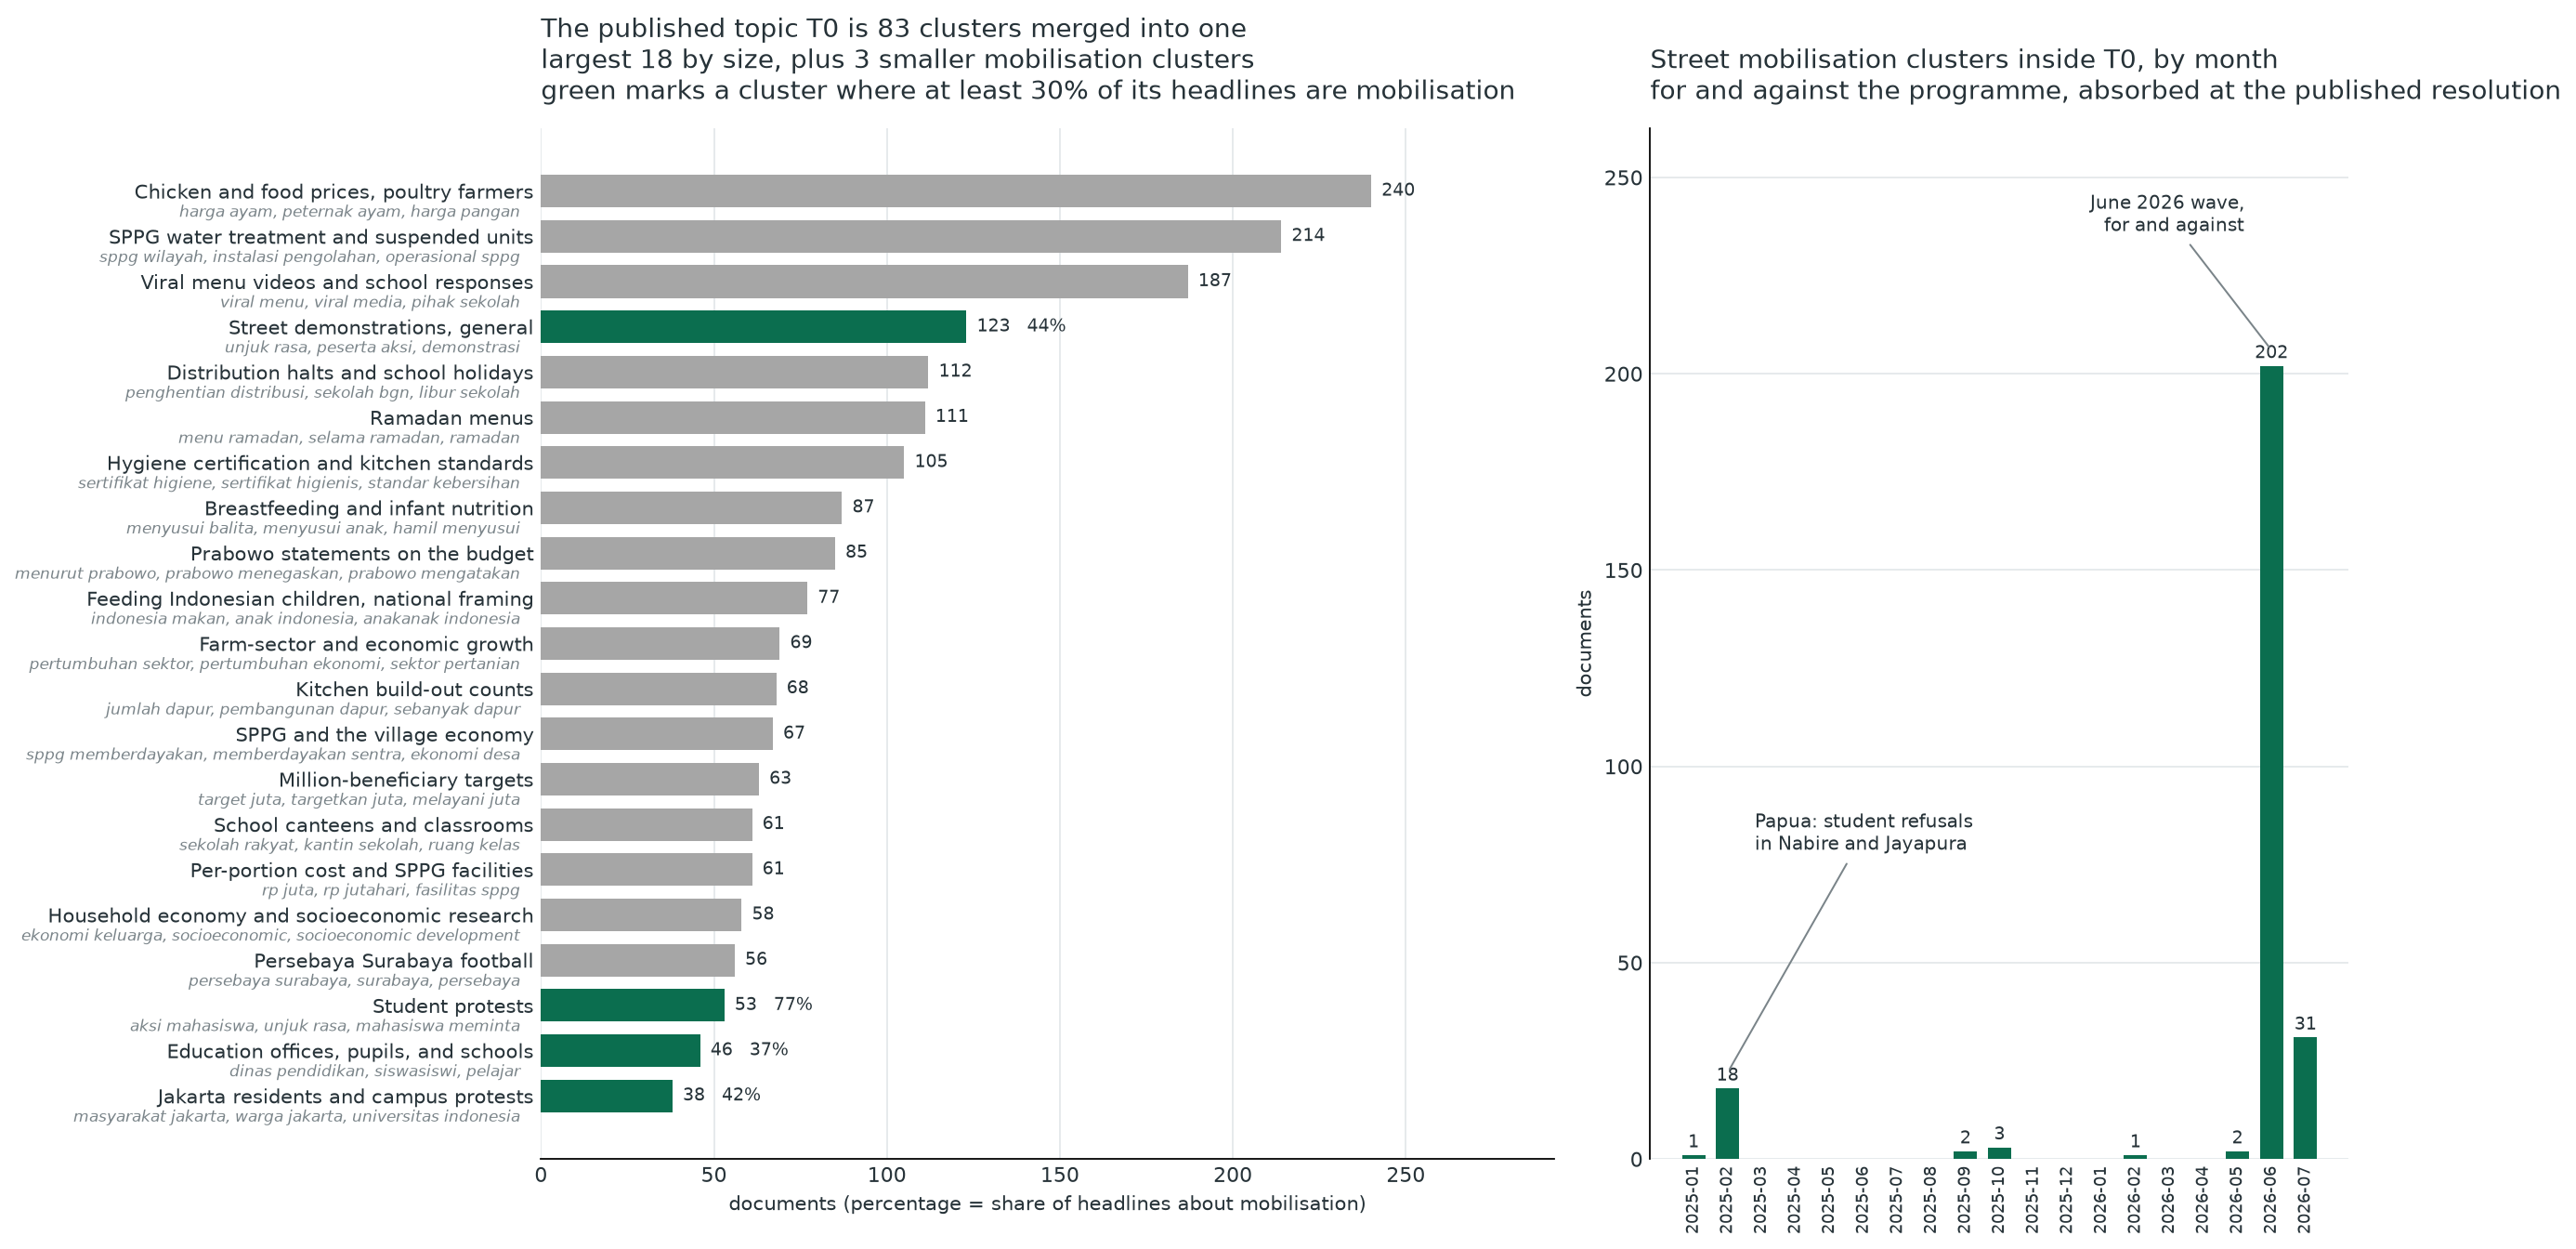
T0 is 83 of the 150 underlying clusters merged into one. Its constituents include chicken prices and poultry farmers (240 documents), SPPG water treatment installations (214), viral menu videos (187), Ramadan menus (111), hygiene certification (105), breastfeeding and infant nutrition (87), and a Persebaya Surabaya football cluster (56). Those are not facets of a single theme. T0 is a residual bucket, and its label describes its largest tendency rather than its contents. This is structural, not an artifact of the chosen resolution: the largest topic still absorbs 73 clusters at a target of 20 and 51 at 28.
The practical consequence is that a real, well-covered theme can be invisible
in the topic list. Street mobilisation is one. Four of T0’s clusters
carry it, 260 documents in total, with leading terms unjuk rasa, peserta aksi, demonstrasi, aksi mahasiswa, and mahasiswa meminta. Matching
titles on demonstrasi, unjuk rasa, aksi massa, turun ke jalan, long march, massa aksi, berunjuk, and demo gives 162 distinct titles across
the whole corpus, of which 135 fall inside T0. All 138 that matched only on
the ambiguous token demo were read individually, since the word also means
a product or cooking demonstration in Indonesian. All 138 are genuine street
mobilisation.
Two things about that coverage a topic label would have hidden. Roughly half of it is mobilisation in support of the programme, by SPPG staff, kitchen volunteers, and organised supporter groups demanding it continue, alongside student protests demanding it stop and a sub-thread disputing whether the supporter rallies were paid or state-directed. And it is not confined to one month: of the 162 titles, 137 fall in June 2026, 13 in July 2026 and one in February 2026, but a separate earlier cluster of 11 sits in February 2025, covering student refusals of the programme in Nabire and Jayapura, Papua.
Sentiment by topic
Tone varies sharply by topic.
Student food-poisoning incidents (T2, n=599) are the clearest negative case:
59.9% of documents carry negative as their highest-probability label,
mean score -0.47.
Corruption investigations and prosecutions (T1, n=925) carry almost the same mean, -0.46, with 50.9% negative labels and almost no positive probability.
SPPG kitchen construction and police-run operations (T4, n=399) run positive, mean +0.25.
The first two hold up. The third does not. Holding the document-level predictions fixed and regrouping them under five projection seeds, corruption stays between -0.46 and -0.41 and food poisoning between -0.47 and -0.43, so both are strongly negative in every seed. But SPPG kitchen construction ranges from +0.25 down to -0.04, so the sign itself flips, and in one seed the topic has no recognisable counterpart at all. Read it as less negative than the rest, not as a positive counterweight.
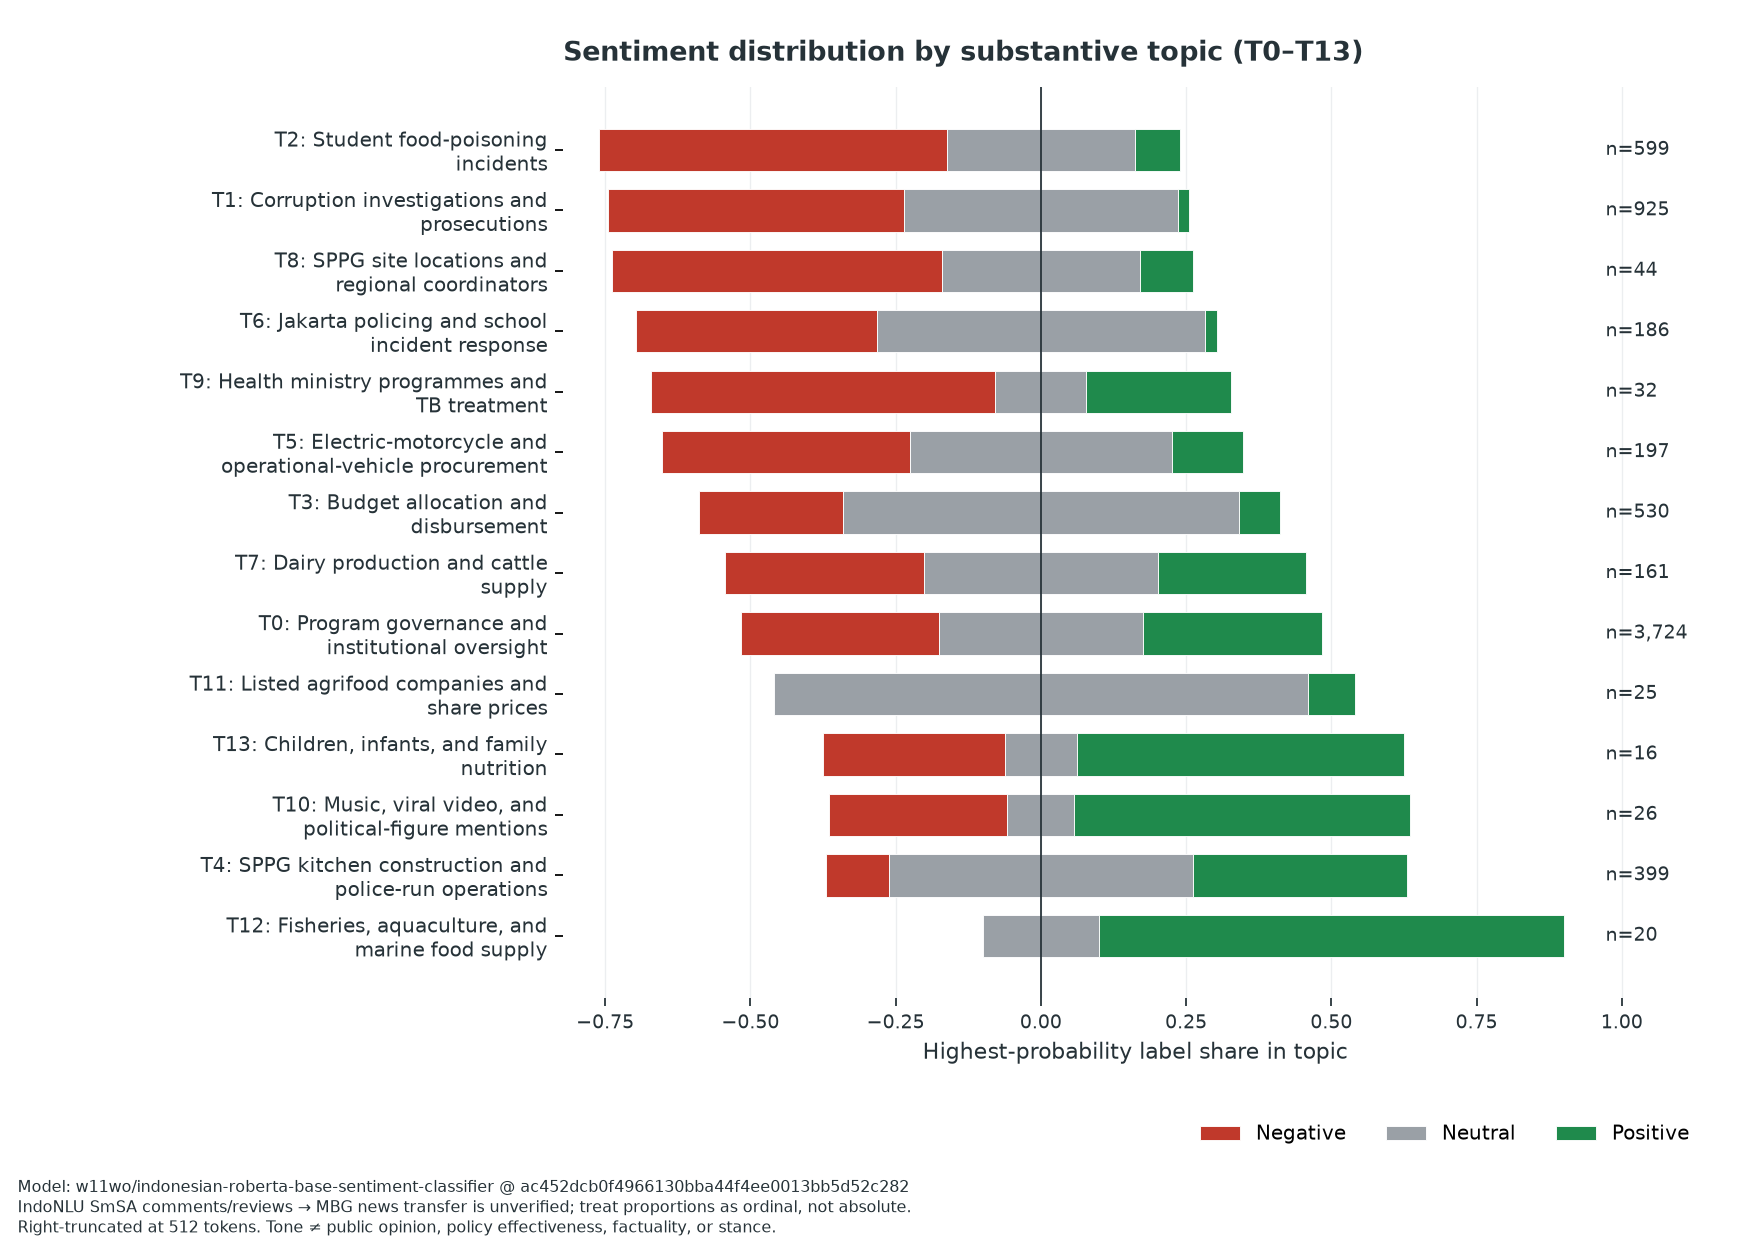
Each bar shows the share of a topic’s documents by highest-probability
label, with the centered grey marker for neutral. Ordering uses the topic
mean of P(positive) - P(negative).
The two measures can disagree. Program governance and institutional oversight (T0, n=3,724) splits into 1,145 positive, 1,310 neutral, and 1,269 negative labels, for a mean of just -0.02: a large topic with genuinely mixed coverage rather than a leaning one, and it stays mildly negative in every seed, between -0.07 and -0.01. Smaller substantive topics hold at most 186 documents each, so their directions are especially provisional, and they are also the ones least likely to reappear under a different seed. The outlier class is kept in the aggregate reconciliation but left out of this figure.
Across the whole corpus: 2,620 positive (24.0%), 4,313 neutral (39.5%), 3,982 negative (36.5%).
What this does not measure. The classifier is an Indonesian RoBERTa model trained on IndoNLU SmSA comments and reviews, not on news. It describes the language tone of retrieved articles after right truncation at 512 tokens. It does not measure public opinion, policy effectiveness, factuality, or stance, and its probabilities support ordinal comparison only, not population estimates.
Who and where the coverage names
Entity extraction surfaces the most-mentioned people, event locations, and kitchen references. Surface-form resolution is provisional throughout.
All three charts rank by documents, not mentions. One article naming someone a dozen times is still one article’s worth of coverage, so ranking on raw mentions would let a single repetitive story outrank an entity covered across many. Each bar prints its mention total beside the document count, so the repetition stays visible.
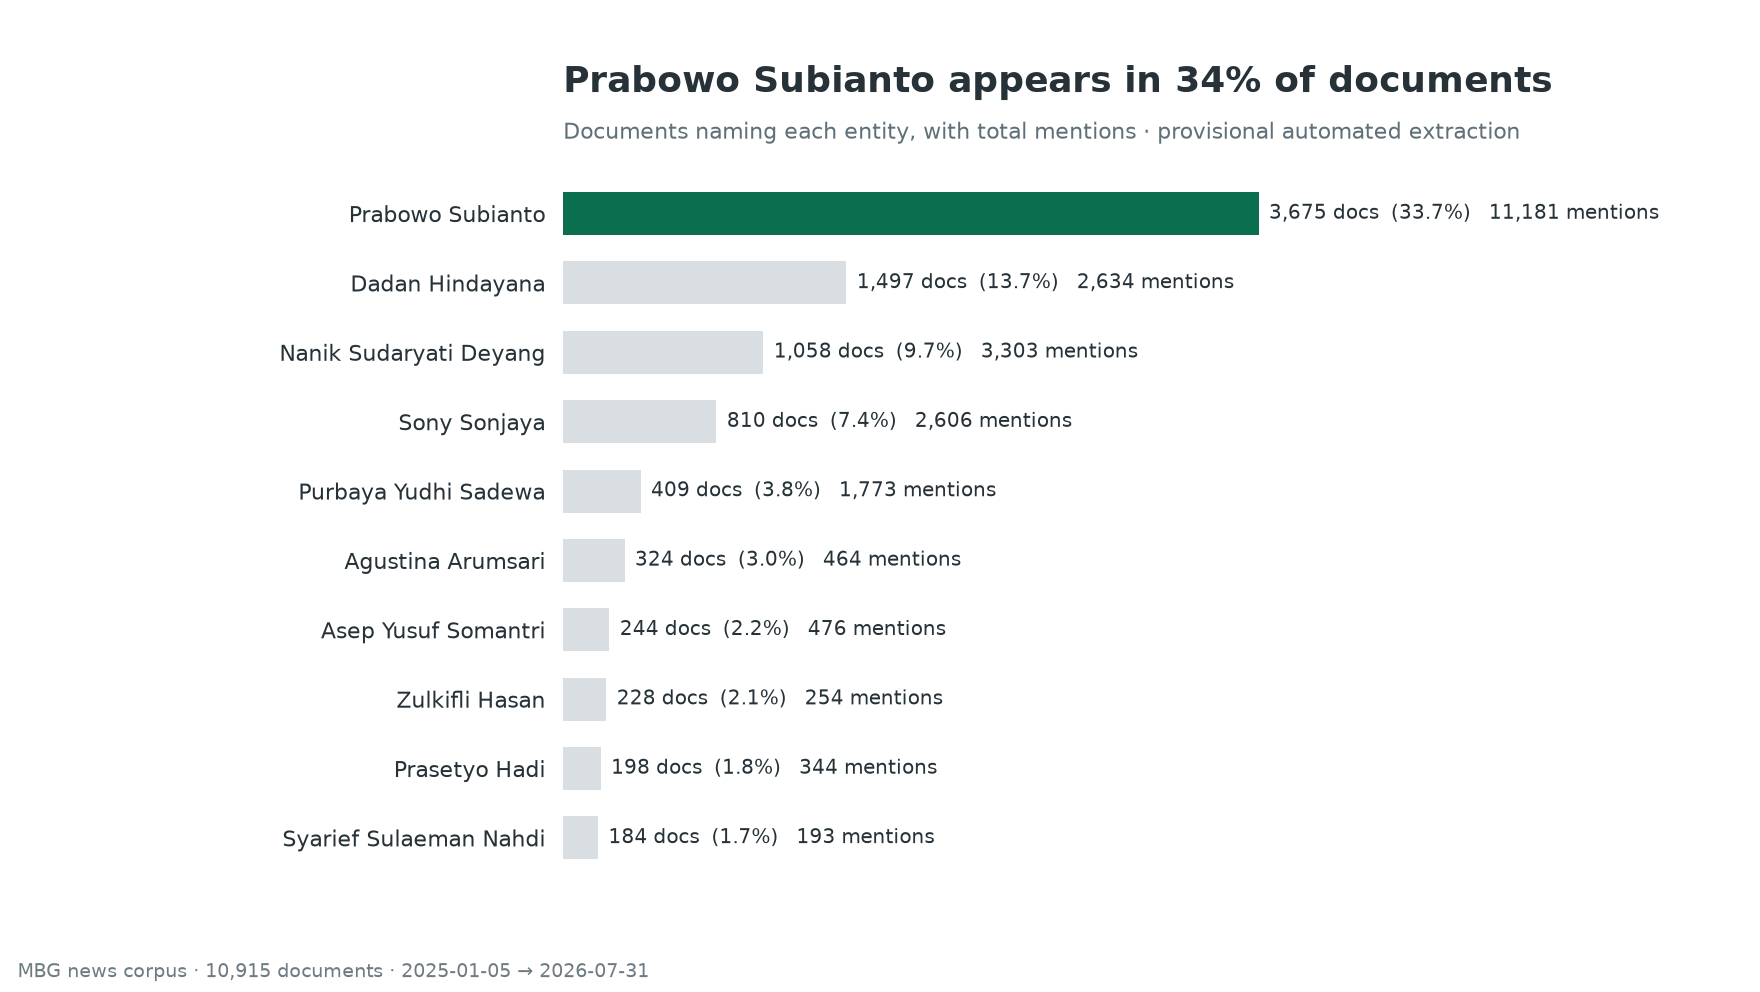
60,886 person mentions resolved to 6,343 normalized surfaces. Ranks
describe prominence in this corpus, not policy importance. Audited aliases
combine Purbaya, Purba, Yudhi, and Yudhi Sadewa into Purbaya Yudhi
Sadewa (1,773 mentions across 409 documents). Ambiguous single-token
surfaces such as Yusuf stay in the aggregate tables but are excluded from
this chart rather than guessed at.
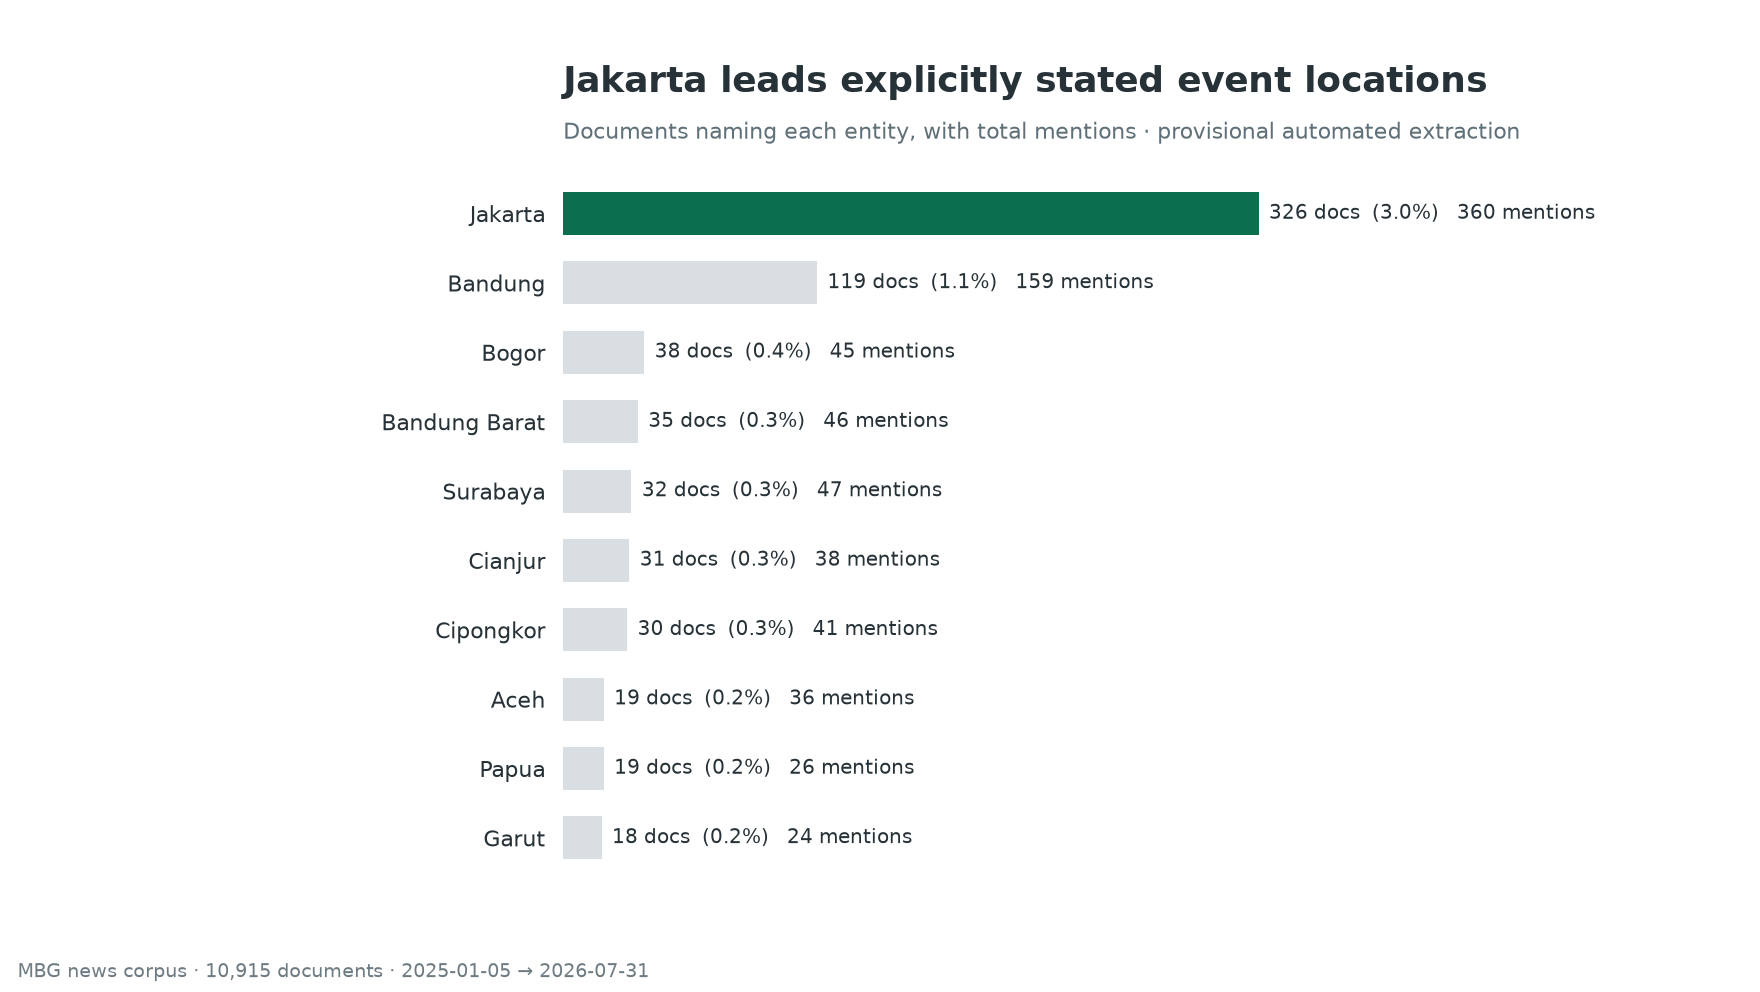
1,962 location mentions resolving to 562 unique places. Counts exclude publisher datelines and general geographic framing, counting only locations anchored to a described event such as a visit, launch, incident, or audit. The chart therefore under-represents places that appear only as byline cities.
Places are settlements and administrative regions only. Venues such as Kompleks Parlemen, Istana Merdeka, and Gedung DPR are excluded, because each sits inside a city that is already counted, so ranking them together would both double-count the coverage and put a building next to a province.
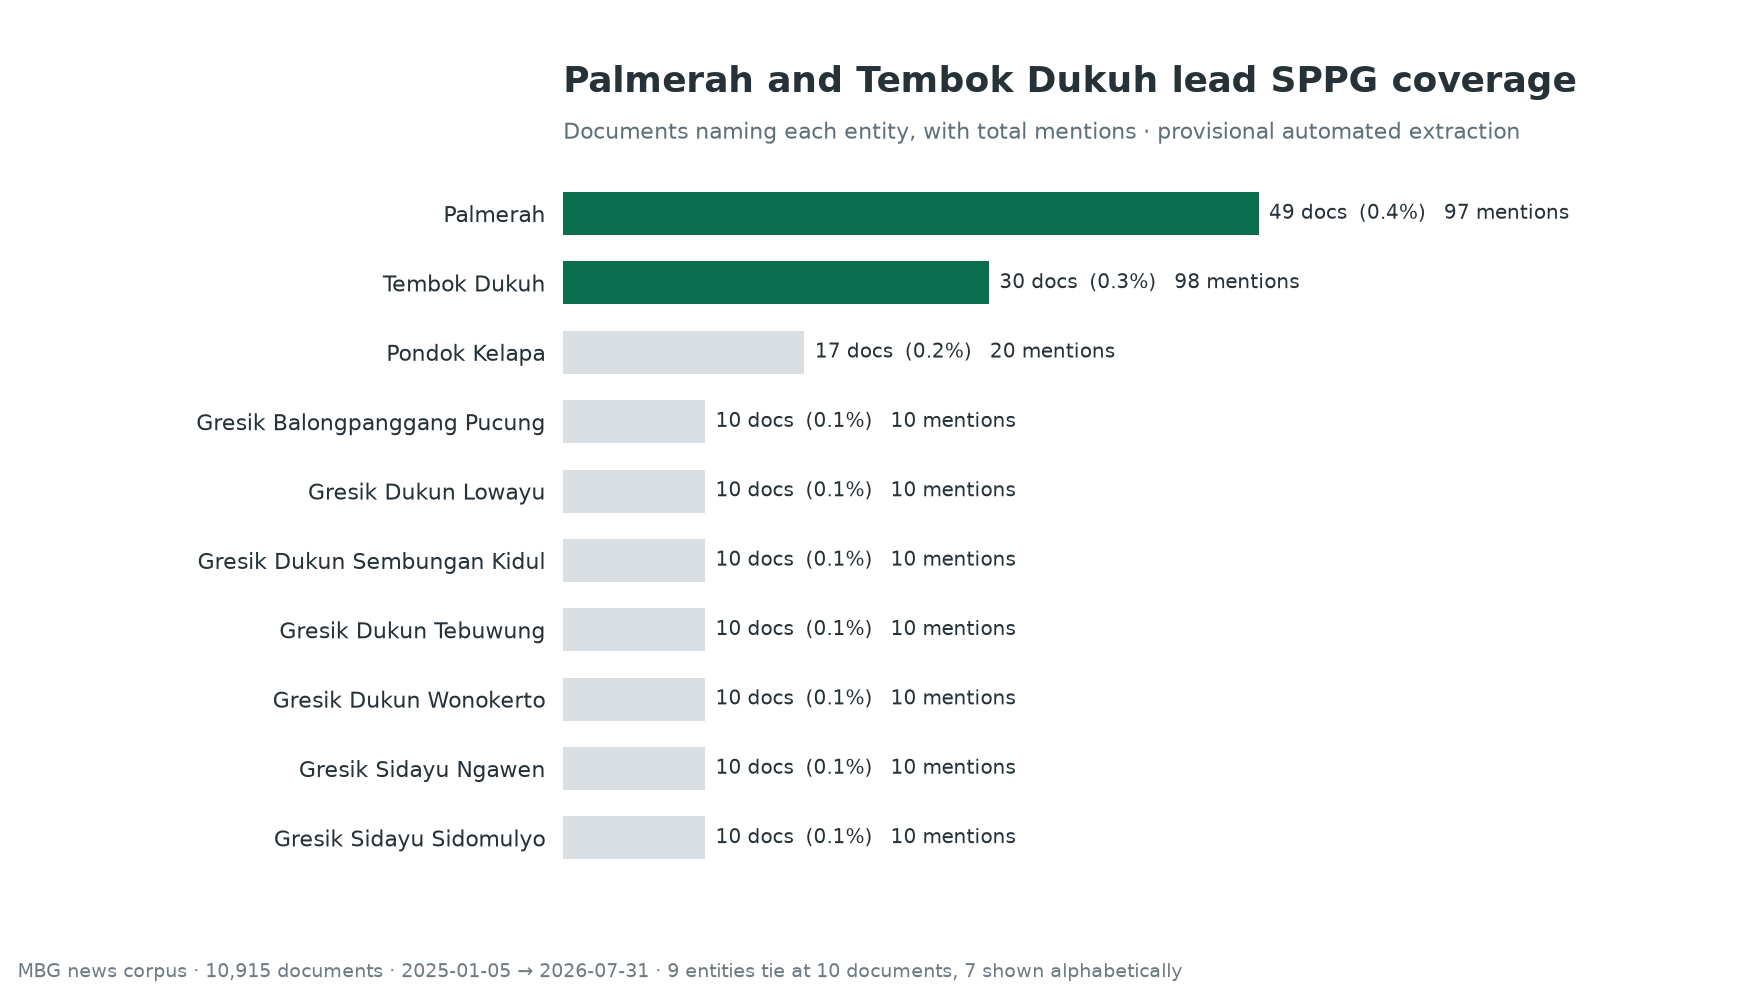
1,760 kitchen mentions resolving to 804 unique surfaces. Unit numbers are preserved where available. Strict normalization drops regional collectives and malformed identifiers. These identifiers are automated and remain provisional until reconciled against operational records.
How documents and people connect
Document similarity
An undirected graph over the document embeddings. Each node is a document; an edge joins two documents whose cosine similarity is at least 0.90 within each document’s k=5 nearest neighbors.
The full graph holds 2,636 active nodes and 2,847 edges across 735 connected components, with 8,279 isolates. The figure shows 36 communities within the 4 largest component groups under a 500-node cap, rendering 499 linked documents. Smaller components are drawn in grey and carry no group annotations.
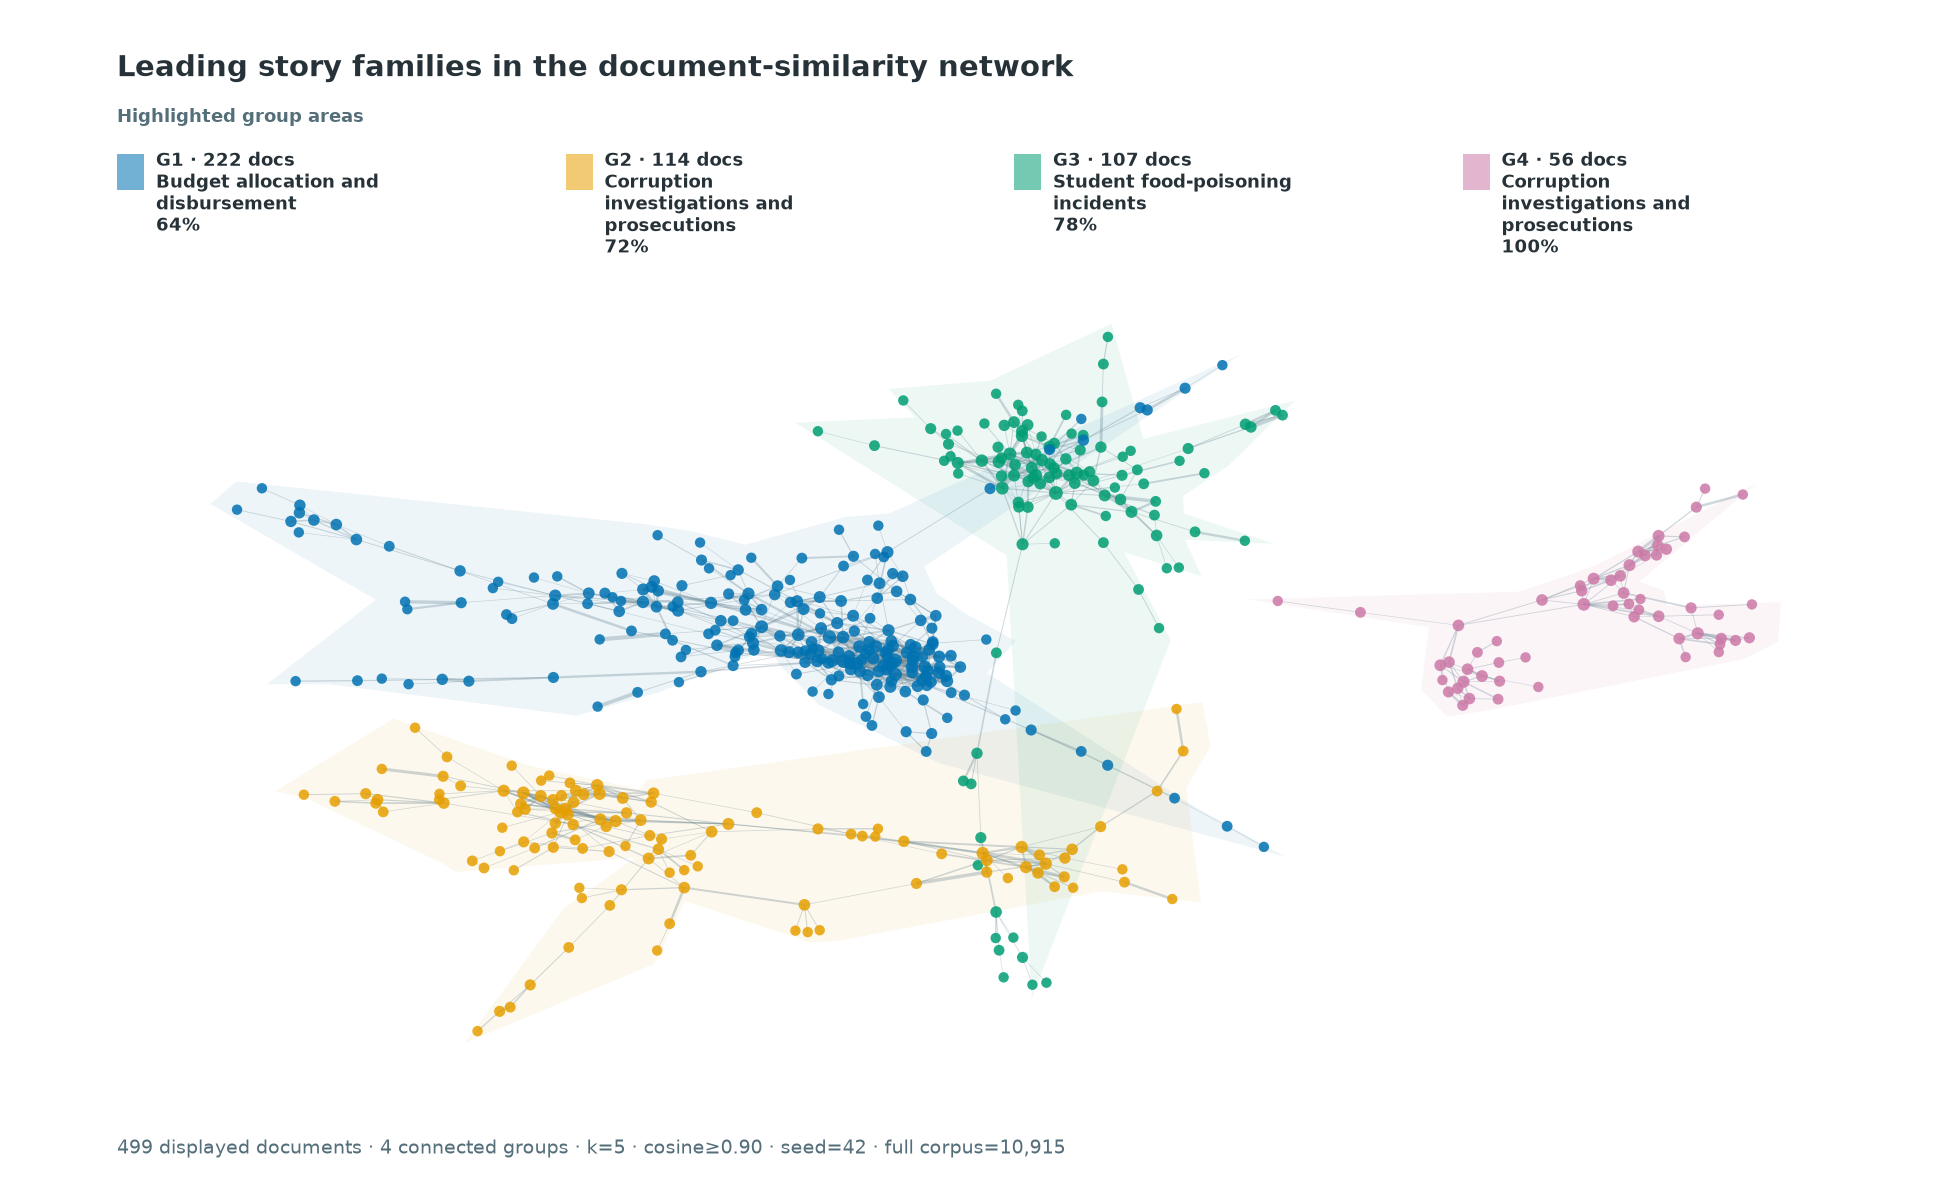
The four leading groups:
- G1, budget allocation and disbursement: 222 documents, 64.4% dominant.
- G2, corruption investigations and prosecutions: 114 documents, 71.9% dominant.
- G3, student food-poisoning incidents: 107 documents, 78.5% dominant.
- G4, corruption investigations, separate component: 56 documents, 100% dominant.
“Dominant” is the share of documents inside the displayed component carrying that topic label. It is not a probability that the component is exclusively about that topic. The fitted color areas follow the displayed extent only and are not confidence regions.
What an edge means. Embedding similarity between two retrieved
documents. Not shared event identity, factual equivalence, causation,
coordination, or editorial influence. The spring layout is deterministic
(seed=42), so the figure reproduces, but position matters only insofar as
it reveals the connected components.
Person co-mentions
An undirected graph where each node is a normalized person surface and an edge joins two people who appear in the same document. Repeated mentions of the same person are deduplicated within a document before counting.
The gates produce 30 nodes and 42 edges across 7 connected components and 8 detected communities.
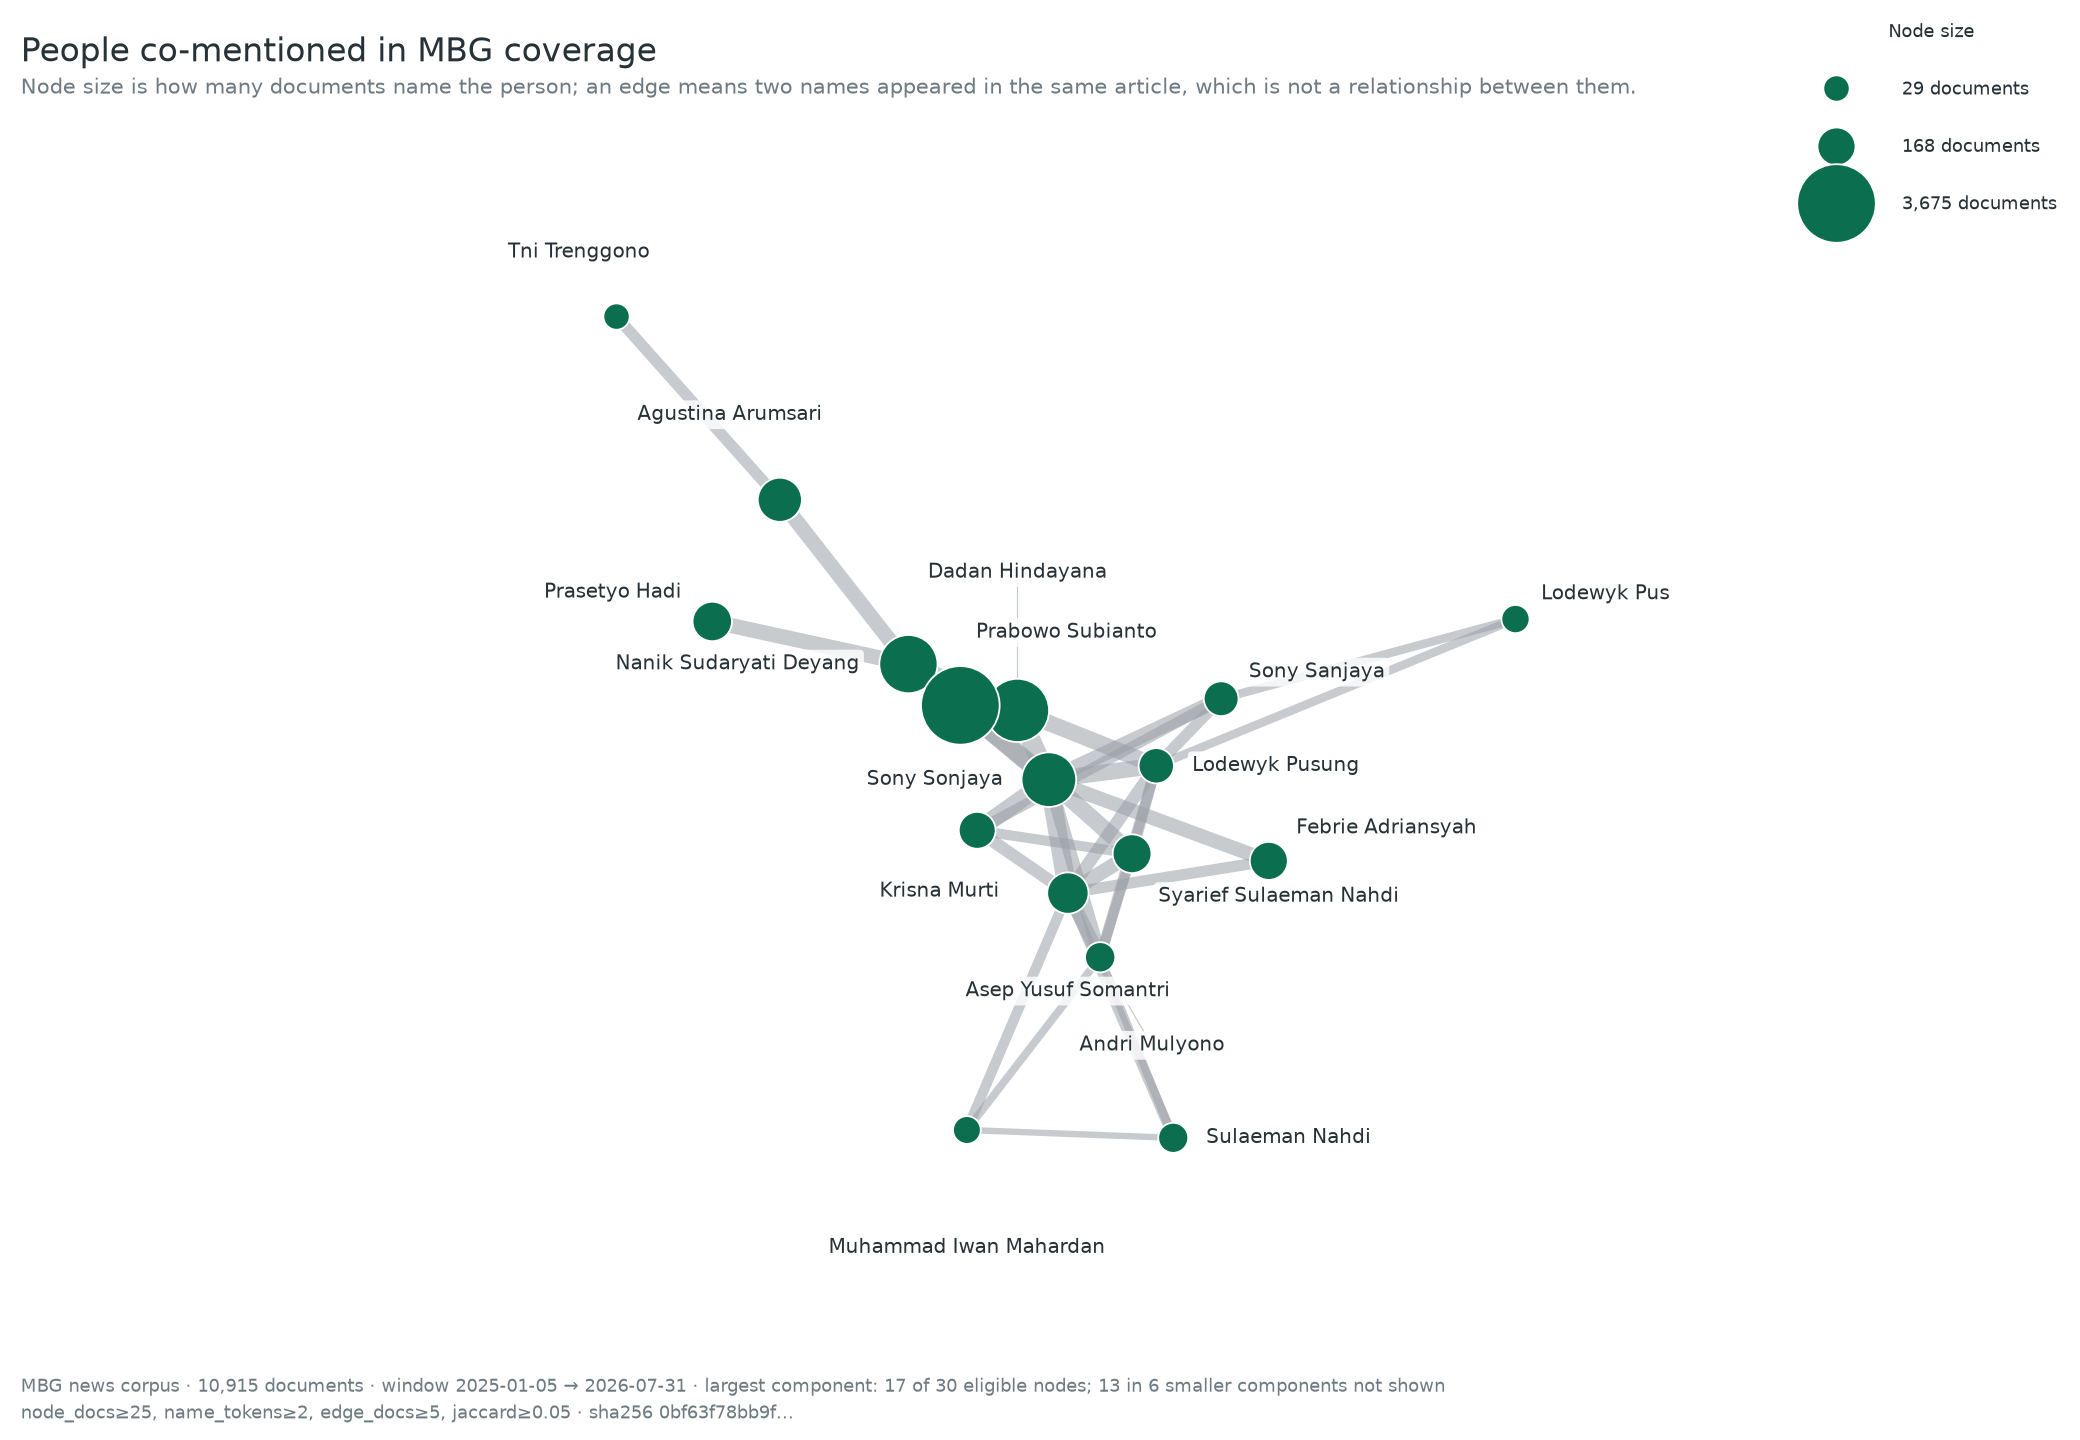
The figure displays only the largest connected component, 17 of the 30 eligible nodes, with the remaining 13 spread across 6 smaller components that are not shown. Larger nodes are people mentioned in more documents; wider edges are higher co-document counts. Community is deliberately not shown as color. Louvain community IDs are arbitrary integers, and coloring them in on a corpus about a government programme invites a political reading the data does not support.
By weighted degree, the most connected surfaces are Prabowo Subianto (1,280, 3,675 documents), Sony Sonjaya (1,275, 810 documents), Dadan Hindayana (1,054, 1,497 documents), Nanik Sudaryati Deyang (890, 1,058 documents), and Asep Yusuf Somantri (417, 244 documents). The strongest single edge is Dadan Hindayana and Prabowo Subianto, 576 co-mentioned documents (Jaccard 0.13). Next: Nanik Sudaryati Deyang and Prabowo Subianto (481), Dadan Hindayana and Sony Sonjaya (235), Prabowo Subianto and Sony Sonjaya (223), Asep Yusuf Somantri and Sony Sonjaya (192).
These stay provisional NER surfaces. There is no general co-reference resolution, so ambiguous identities may still split or merge.
What co-mention means. Shared coverage within the same retrieved document. Not a personal relationship, influence, endorsement, coordination, political alignment, or causality.
Limits
Retrieval coverage. Only sources in the news-watch registry are searched. The stable search-capable subset was 68 of 75 entries at collection time.
Keyword recall. Six queries drive retrieval: mbg, makan bergizi gratis, program MBG, satuan pelayanan pemenuhan gizi, SPPG, and
badan gizi nasional. Articles discussing implementation without any of
those terms are missed.
Completeness. The corpus is bounded by what each source’s search endpoint exposes. Some cap depth, return only top-N results, or paginate inconsistently. Re-running with a tighter window does not necessarily close those gaps.
Topic structure. No tested resolution satisfies more than one of the three stability criteria, so topic counts, labels, and per-topic shares are one plausible partition rather than the partition. Prefer all-document figures wherever one exists.
Copyright. Each record is a news article record: title, link, publish date, author, and the content excerpt the source itself returned. This supports aggregate analysis and downstream modeling within fair-use research bounds. It is not a redistribution of article text, and each publisher’s terms apply.
Reproducing this
The collection command, the five validation steps, the counts at each cleaning stage, and the citation formats are documented with the tool: