PriorityX
Prioritize entities and detect escalation using GLMM statistical models. Use the Python API to analyze event data, and AutoViz to inspect saved results through linked interactive charts.
Get started
- Install PriorityX — Python 3.12+, macOS/Linux and Windows setup.
- Try AutoViz — open the saved IT incidents sample without fitting models.
- Analyze your data — fit a matrix, track movement and detect transitions.
AutoViz
Explore a quadrant matrix → YTD transition timeline → trajectories workspace. Select an entity across charts, read exact values, adjust layouts and export an interactive view that reopens offline.
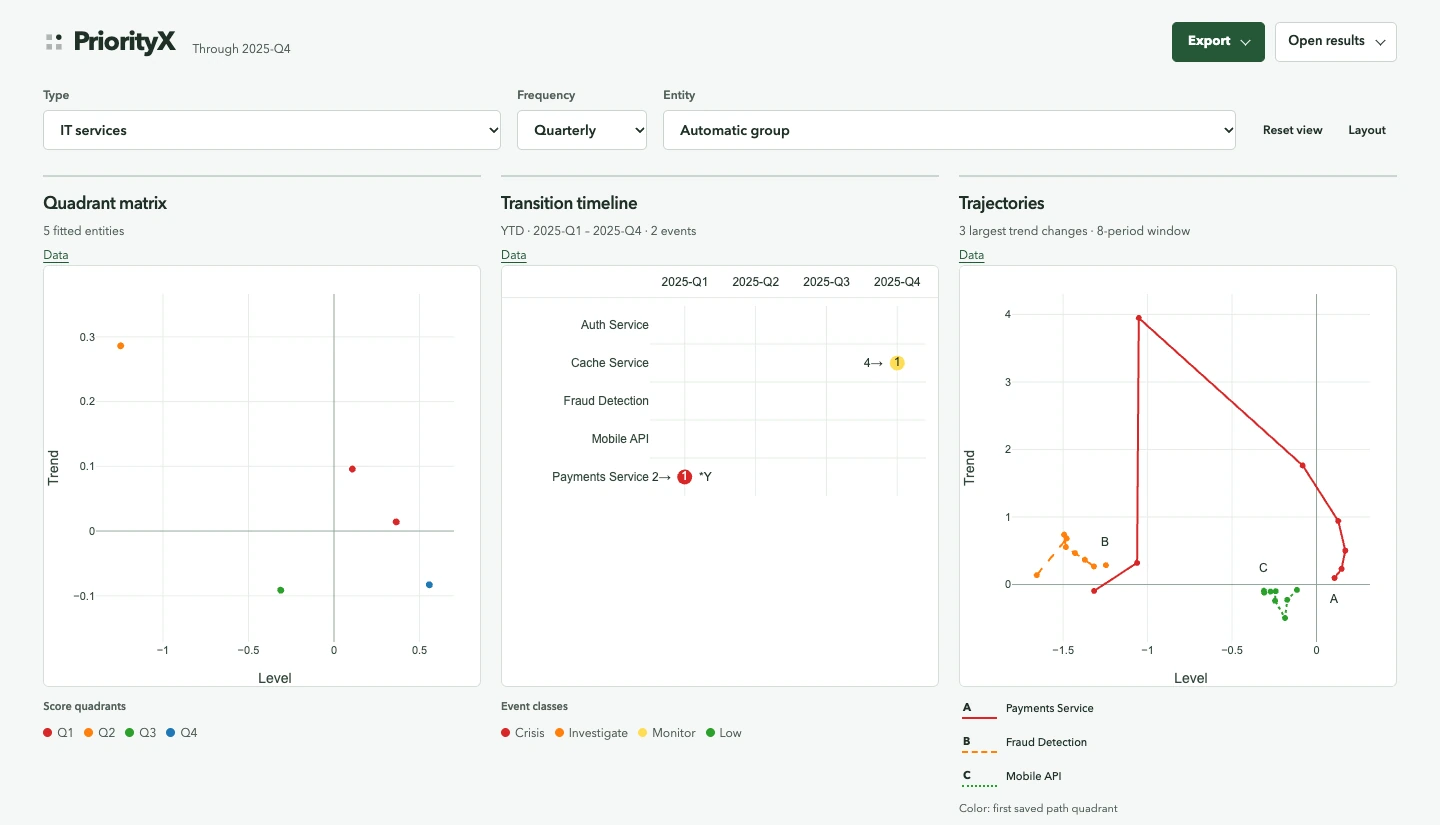
See the workspace guide for controls and exports, and the saved-result contract for bundles, identity/date columns and CSV mapping.
Python analysis
PriorityX provides GLMM-based quadrant scores, cumulative movement tracking, transition detection, driver analysis, custom axes and weighted composite indices. The API reference covers parameters and outputs; methodology explains the models and priority classification explains quadrants and events.
Examples include IT incidents, software bugs and compliance monitoring.