AutoViz example: IT incidents
Open existing saved results from PriorityX’s IT incidents example to explore all three charts without running an analysis.
Open the sample
Install PriorityX, then save the
example bundle
as incidents-quarterly.json. Run the command from the folder where you saved it:
python -m priorityx app --bundle incidents-quarterly.jsonIf you have this repository locally, use
python -m priorityx app --bundle examples/autoviz/incidents-quarterly.json
from its root. On Windows without environment activation, replace python with
.\.venv\Scripts\python.exe.
Explore the charts
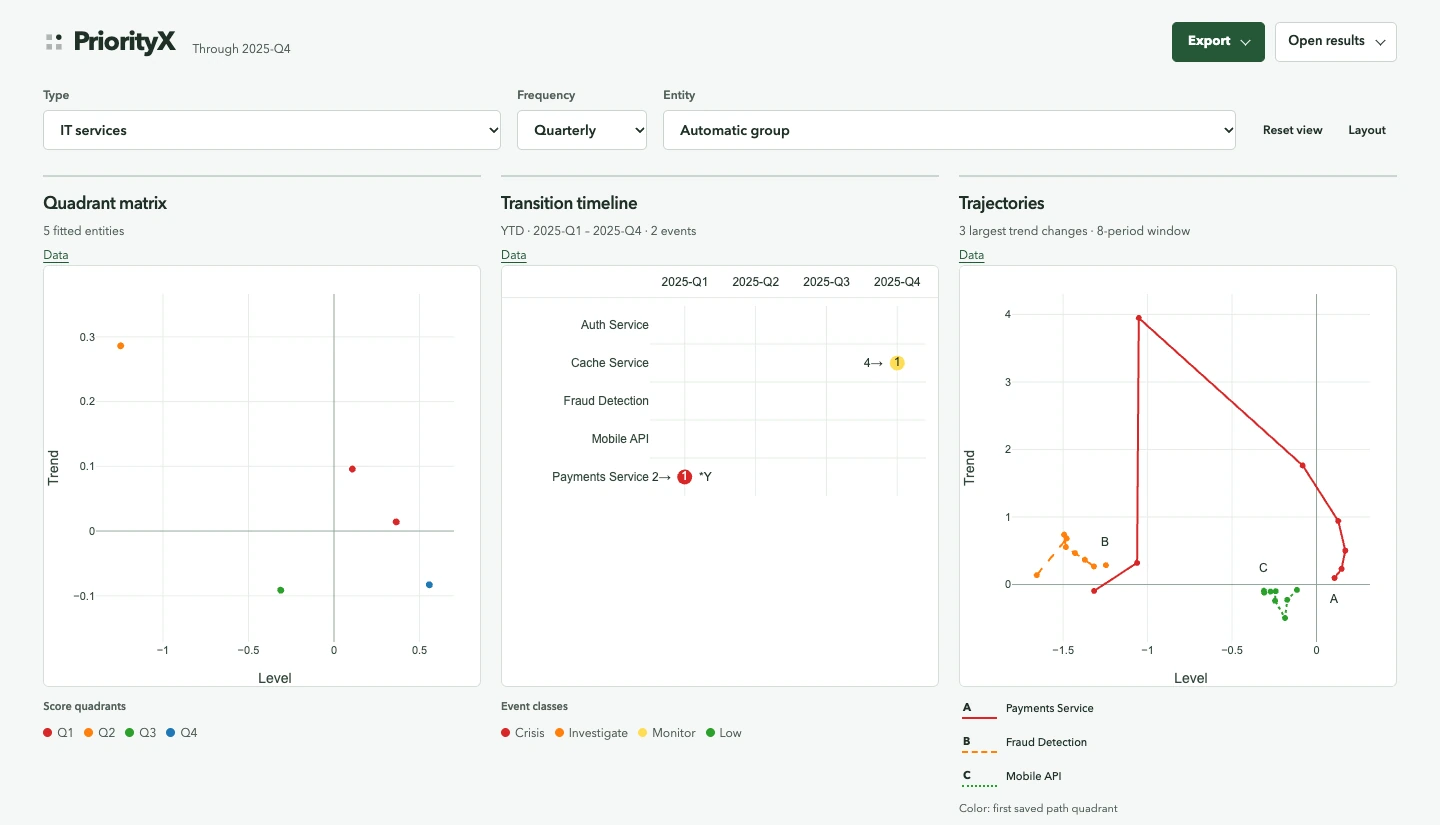
- Compare the five services. The workspace opens on IT services and Quarterly, through 2025-Q4. The matrix shows each service’s saved level/trend scores at that snapshot.
- Inspect an event and its path. Select Payments Service using Entity or its matrix point. Its timeline includes a 2025-Q1 event; its trajectory shows the recent saved path. The timeline displays Q1–Q4 of the saved year, while the trajectory window spans the latest eight quarters.
- Read exact values. Open View data and switch between Matrix, Timeline and Trajectories. Clear selection restores the automatic group of up to three paths; Reset view restores the chart ranges.
- Adjust and reopen. Open Layout, change panel height and apply it. Choose Export → Save offline HTML, then open that file after stopping the Python app. Selection, chart views and applied settings travel with the file.
The sample contains Quarterly results only. Add a Monthly dataset to your own bundle to enable that frequency; the app does not invent or resample results. See the workspace guide for complete controls and export behavior.
Data and provenance
The bundle is a five-service extract of existing saved analytical outputs from the repository’s IT incidents example. Its services are Auth Service, Cache Service, Fraud Detection, Mobile API and Payments Service.
| Saved table | Sample contents |
|---|---|
| Matrix | 5 service scores, snapshot 2025-Q4 |
| Movement | 60 points: all 12 quarters from 2023-Q1 through 2025-Q4 for each service |
| Transitions | All 10 saved events for those services across the full history |
The existing saved trajectory export contains these five services; the original matrix and transition exports contain 16. The sample keeps the matching matrix and event rows and every saved movement row for the five available histories. It preserves saved scores, periods, quadrants and events without refitting or changing the source files. The 2025 YTD display includes two events; earlier events remain in the bundle for full-history preparation.
Source basenames and SHA-256 hashes are embedded in the bundle. The saved source
files are priority_matrix-service-Q.csv, trajectories-service-Q.csv and
transitions-service-Q.csv from the incidents example. Their original fit version
was not recorded; the bundle’s producer version identifies the packaging step.
This is a demonstration of existing saved results, not a benchmark or a new fit.
For your data, follow the saved-result contract.
The raw event columns for the incidents analysis are service and opened_at;
AutoViz instead reads saved entity, quarter and transition_quarter fields,
with as_of dating the matrix snapshot. Other data sources can use their own
columns in a caller adapter; these example names are not app requirements.